ggplot(data = df_dartpoints)
ggplot2 - you need to install and load it first!ggplot() we will need three layers - data, aesthetics / mapping and geometryData:
ggplot(data = df_dartpoints)
ggplot(data = df_dartpoints, mapping = aes(x = Length, y = Weight))
ggplot(data = df_dartpoints, mapping = aes(x = Length, y = Weight))+
  geom_point()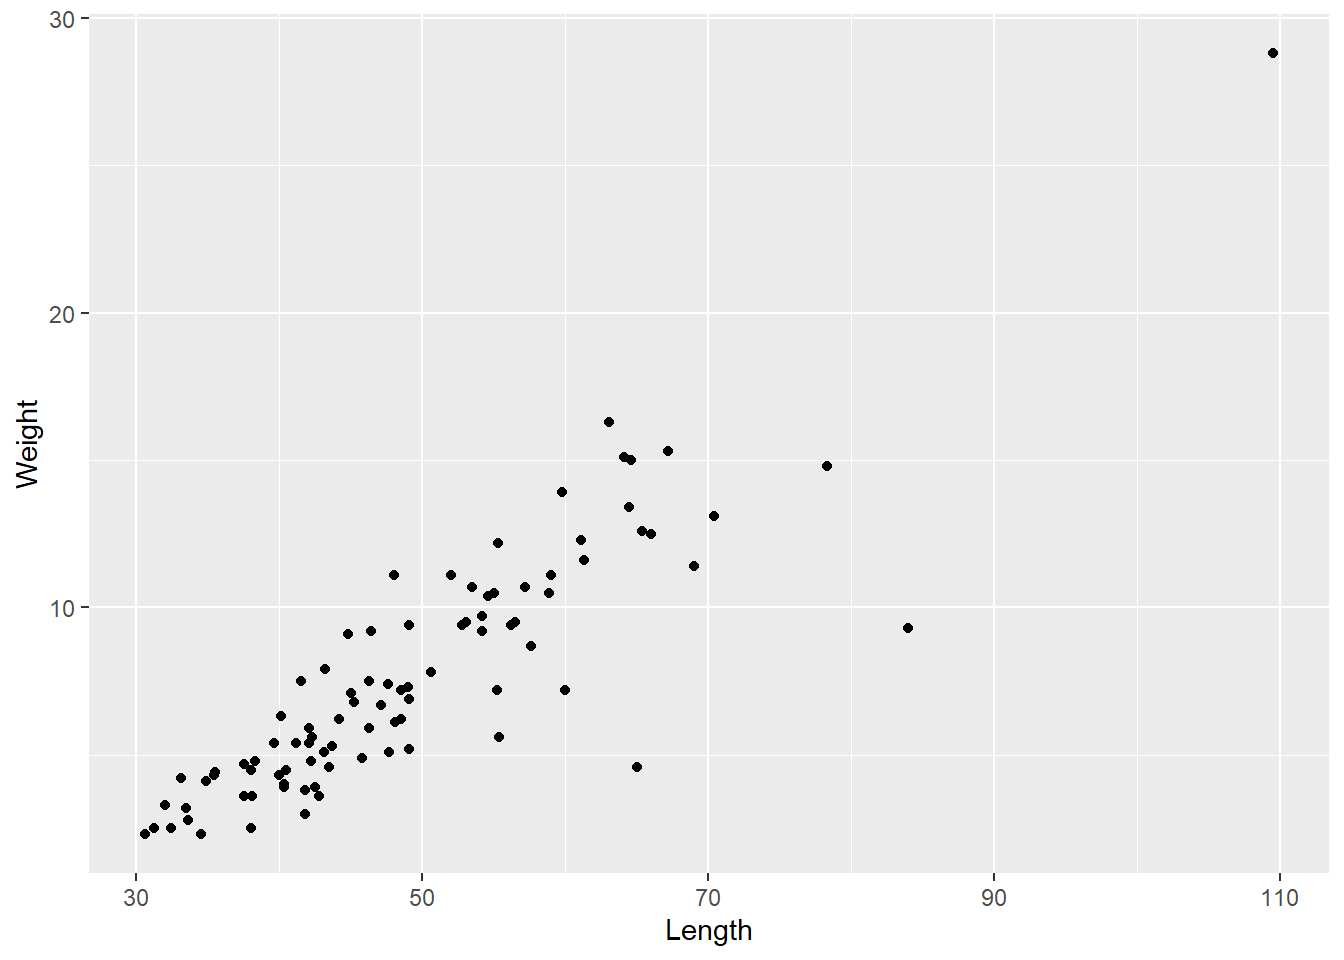
ggplot(data = df_dartpoints, mapping = aes(x = Length, y = Weight))+
  geom_point(color = "red", alpha = 0.5, size = 3)+ # setting of the points
  labs(title = "Dartpoints", x = "length (mm)", y = "weight (mm)") + # adds title and changes x and y axis text
  theme_light() # sets specific theme (visual style)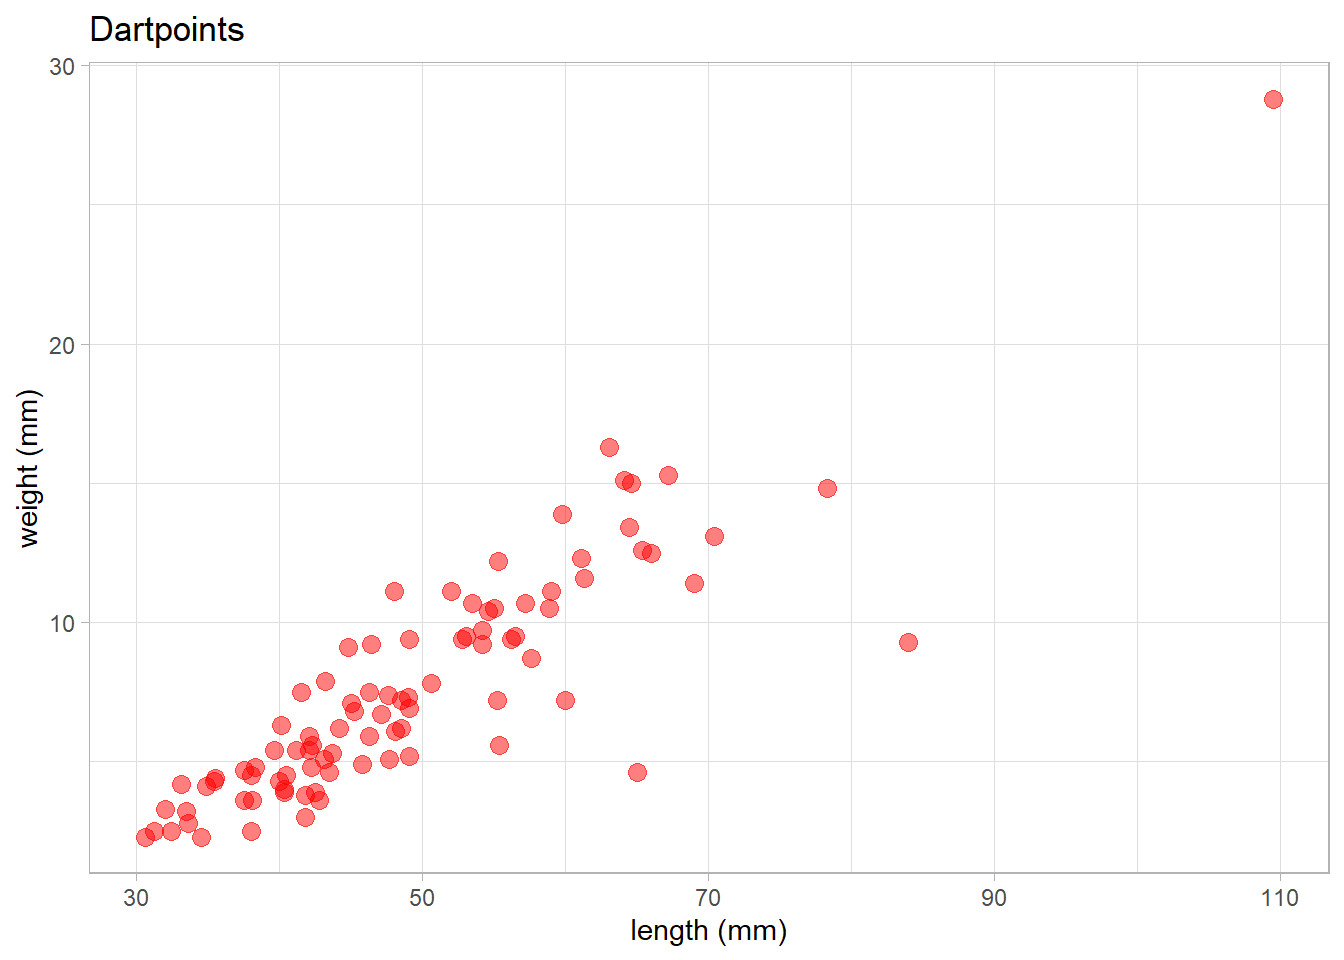
Task: change the shape of the points to squares by by setting “shape = 15” in geom_point(). Try also other shapes.
ggplot(data = df_dartpoints, mapping = aes(x = Length, y = Weight, color = Name))+
  geom_point()+ # note that in this case, we are leaving settings here empty
  labs(title = "Dartpoints", x = "length (mm)", y = "weight (mm)") +
  theme_light()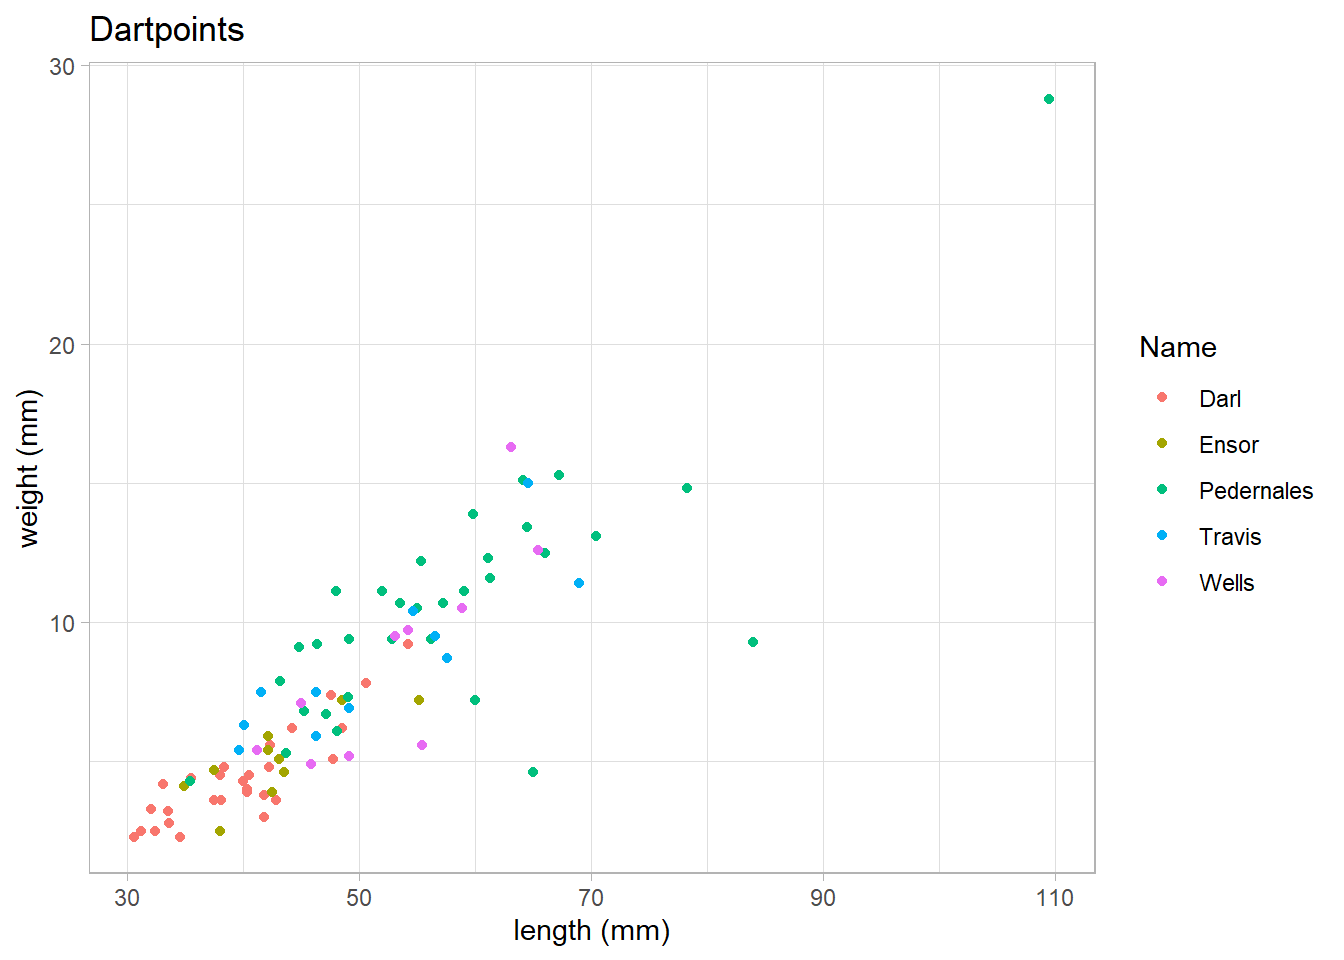
NOTE that when we want the color to be depended on particular variable, we need to specify it in mapping = aes(), but when we want to set the color regardless of any variable (e.i. we want that all points have the same color specified by us), we need to set it in the geom_point()
If we want to have color and shape of the points to be based on specific variable, but also want to make them all bigger, we can combine mapping and setting:
ggplot(data = df_dartpoints, mapping = aes(x = Length, y = Weight, color = Name))+
  geom_point(size =  3, alpha = 0.5)+
  labs(title = "Dartpoints", x = "length (mm)", y = "weight (mm)", color = "Dart type") +
  theme_light()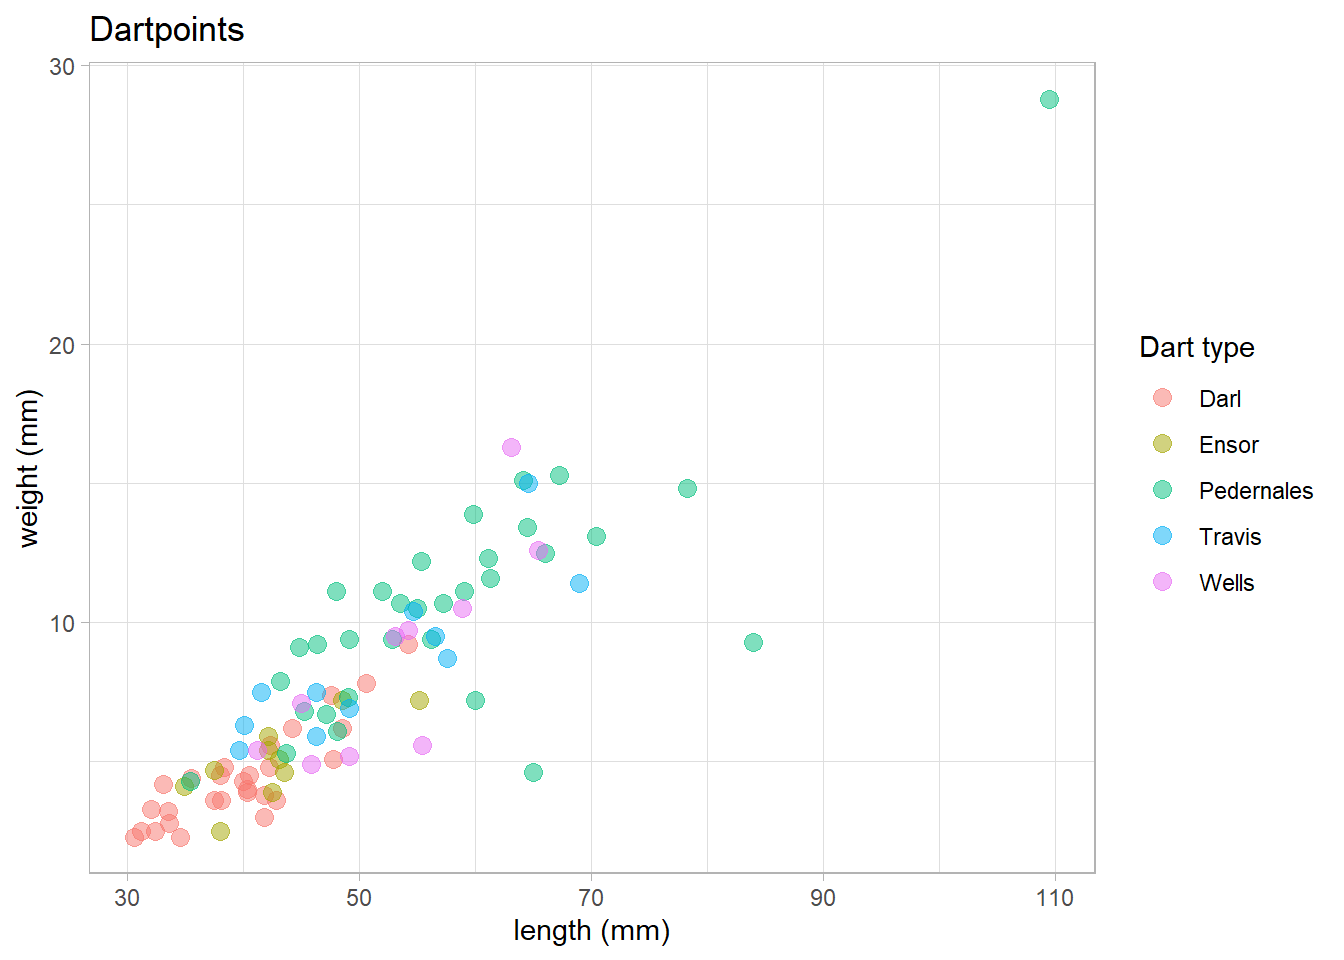
<- to save your plot as an object in R enviromnentmy_plot <- ggplot(data = df_dartpoints, mapping = aes(x = Length, y = Weight, color = Name))+
geom_point(size = 3, alpha = 0.5)+
labs(title = "Dartpoints", x = "length (mm)", y = "weight (mm)", color = "Dart type") +
theme_light()my_plot
ggsave()ggsave(filename = here("figs/my_very_first_plot.png"), plot = my_plot)ggsave() will defaultly save your last created plot, so you don’t need to save your plot beforeggsave(filename = here("figs/same_plot.png"))