Normal distribution
Normal distribution
bell-shaped curve, Gaussian distribution
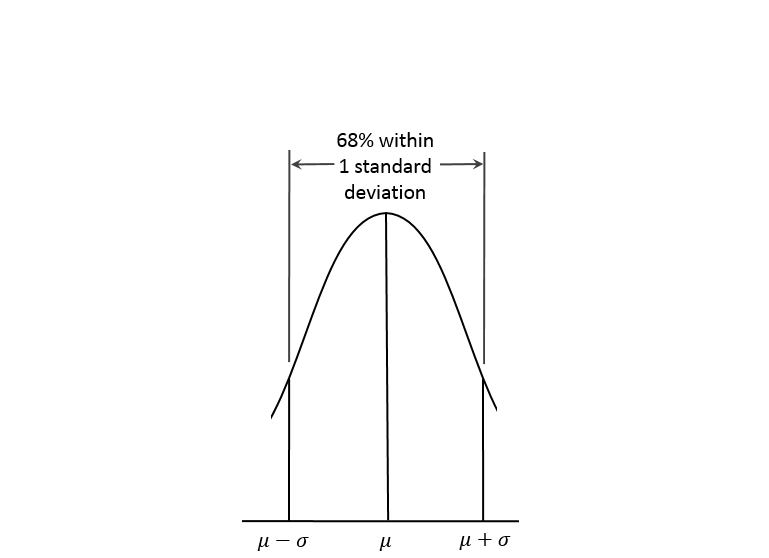
Normal distribution
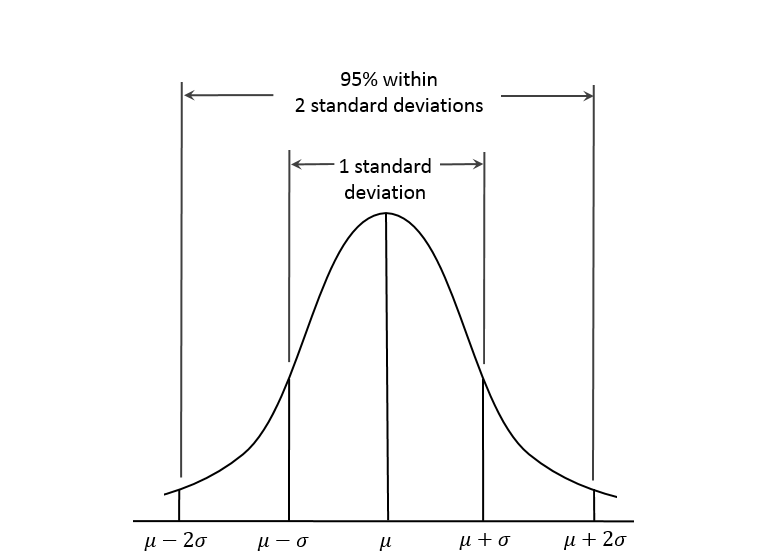
One standard deviation (one sigma)
Normal distribution
Two standard deviations (two sigma)
Normal distribution
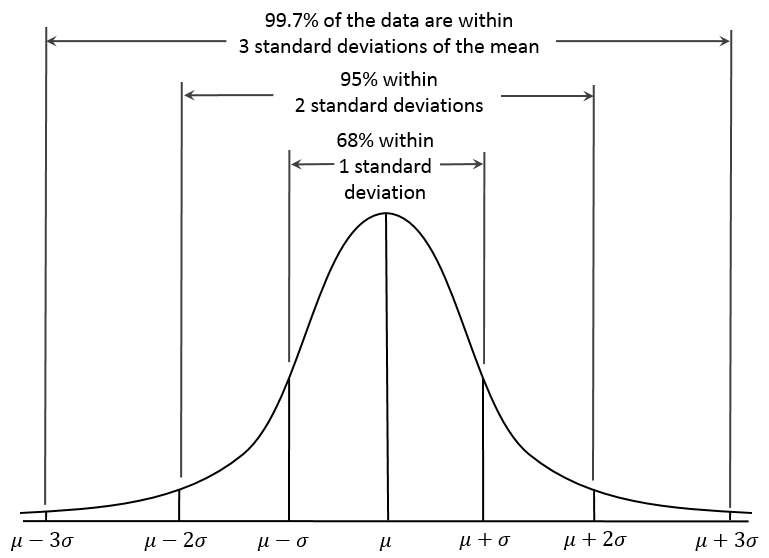
Three standard deviations (three sigma)
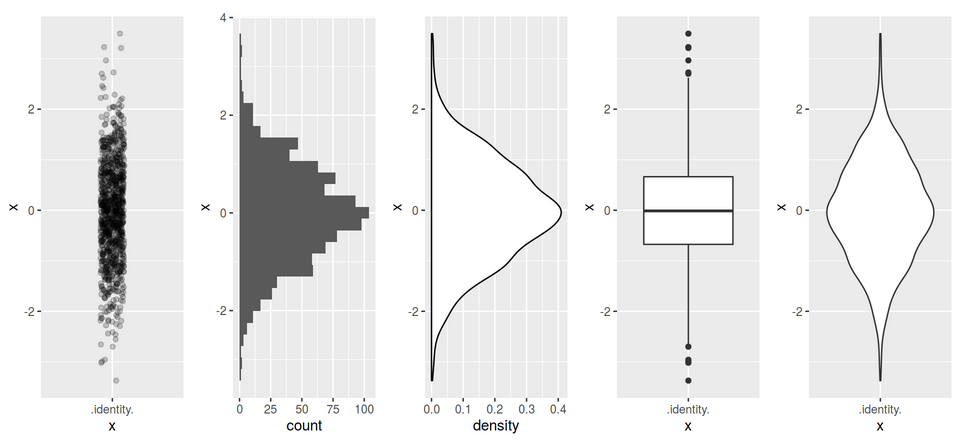
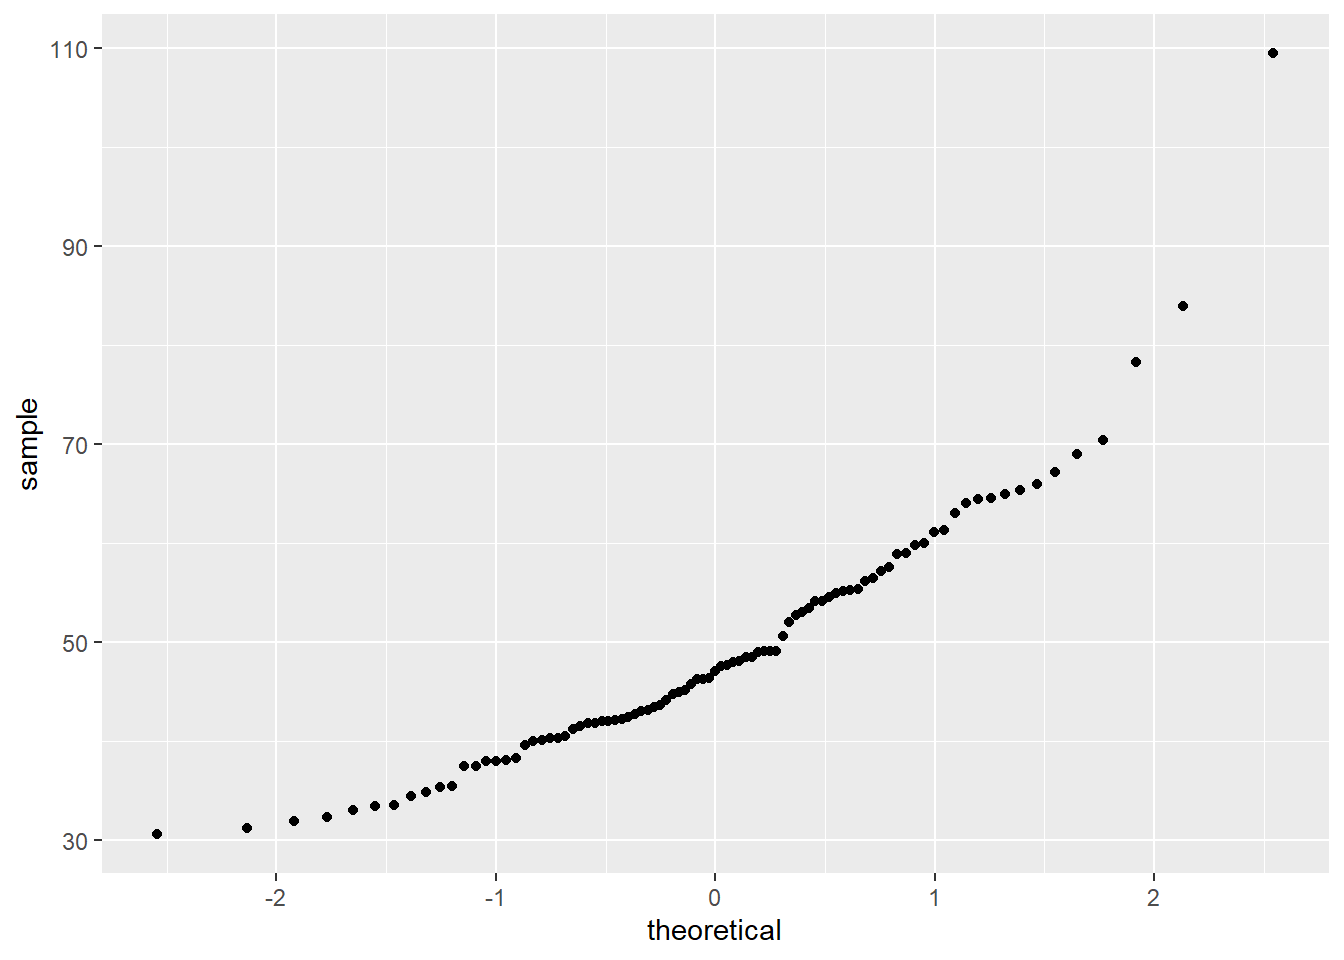
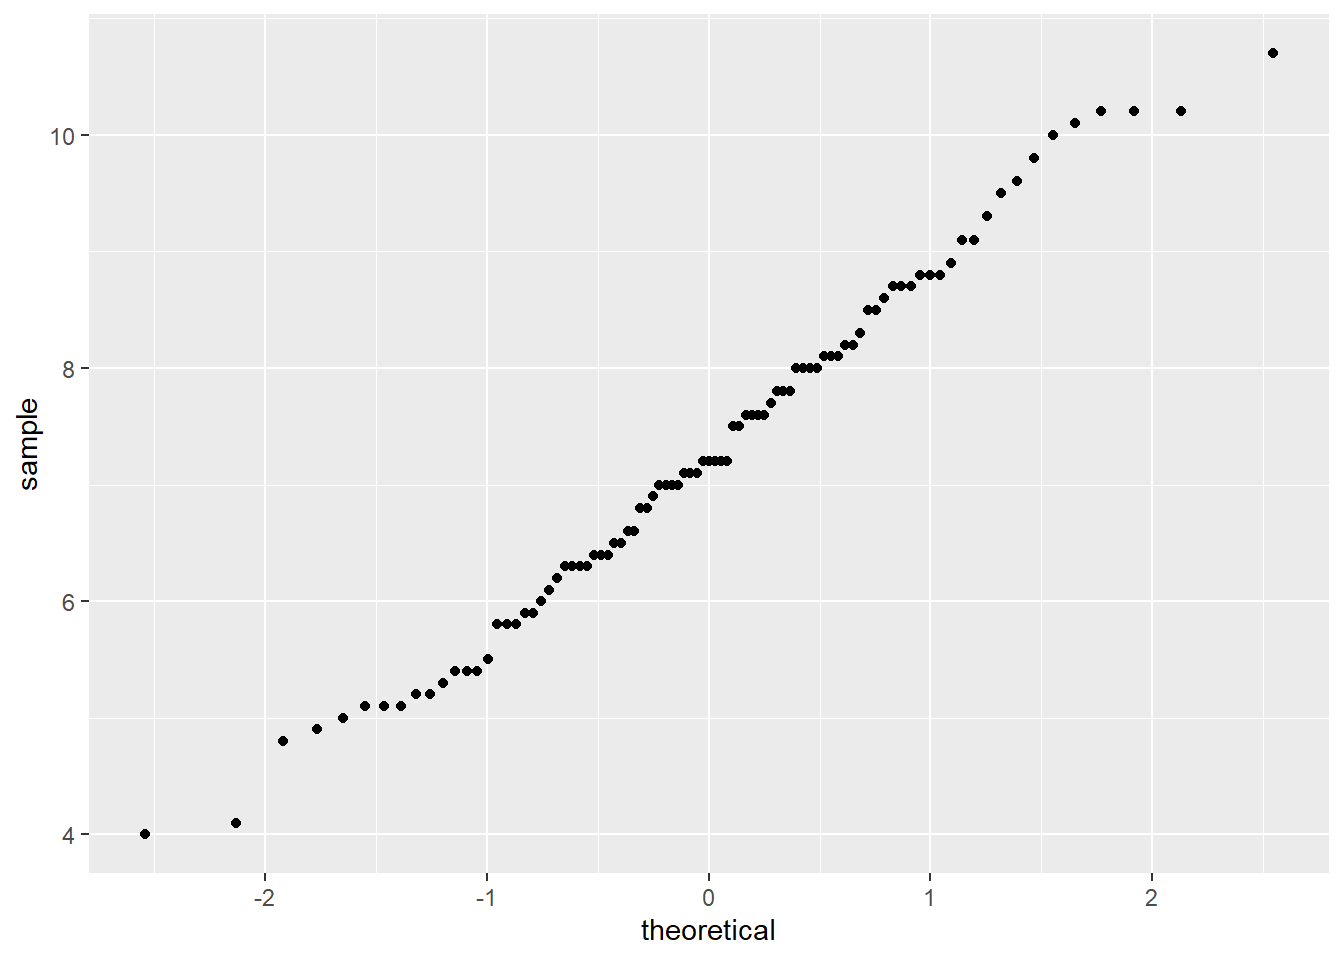
Q-Q plot
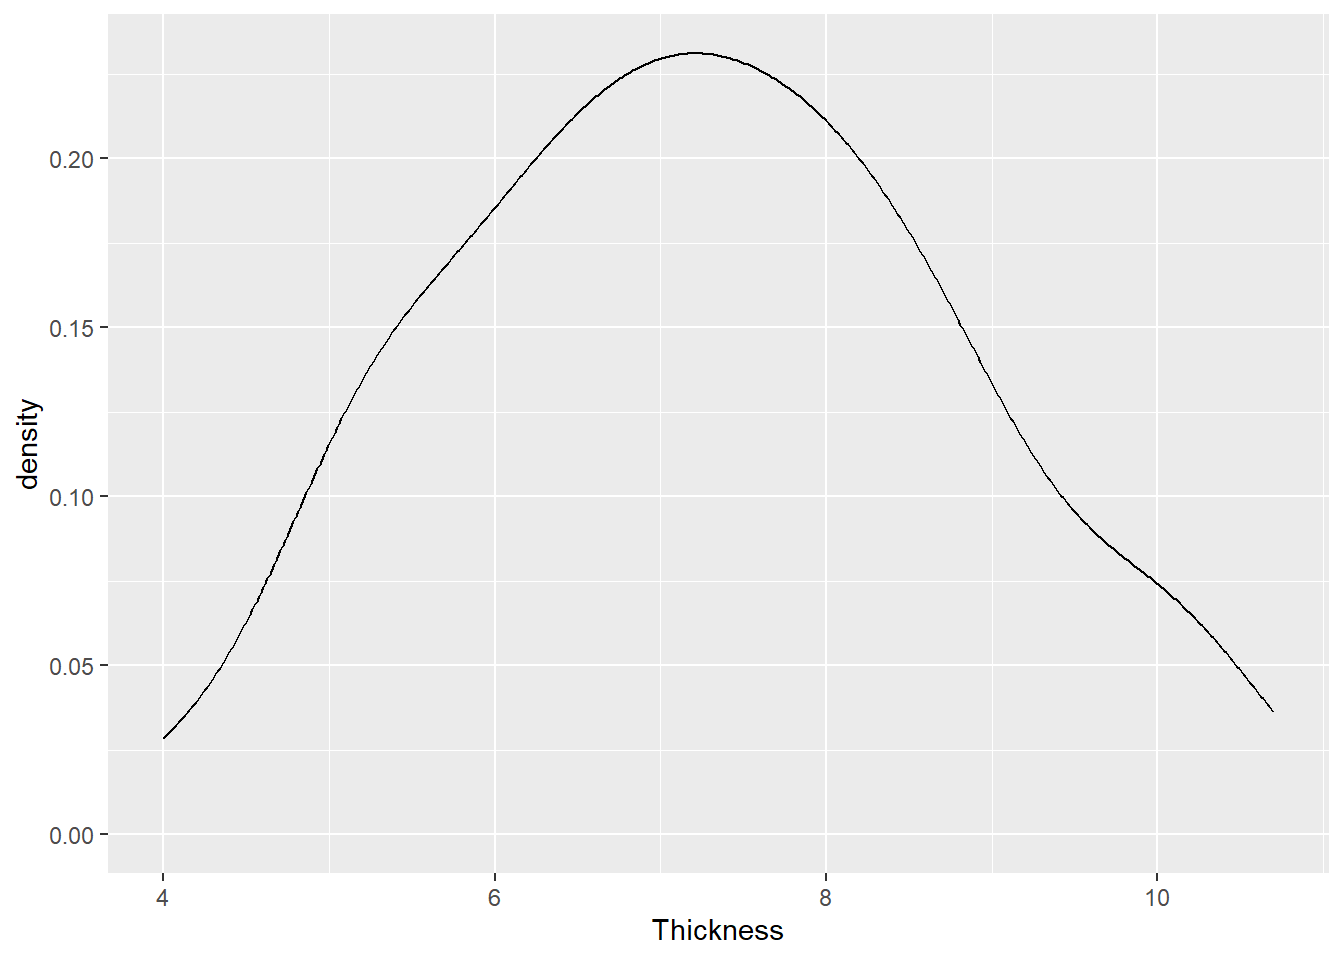
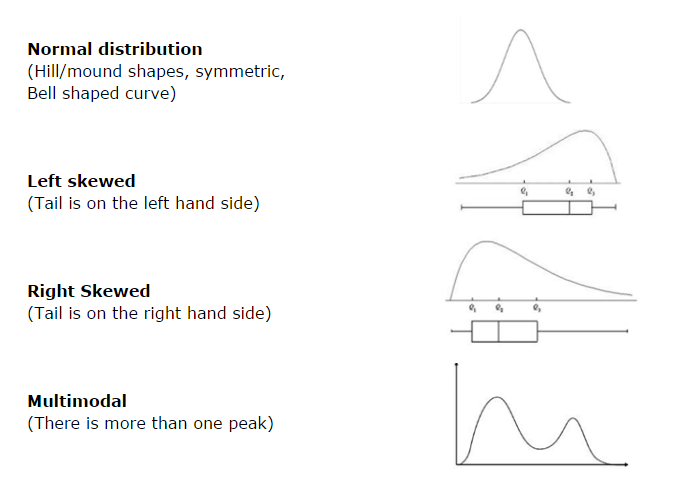
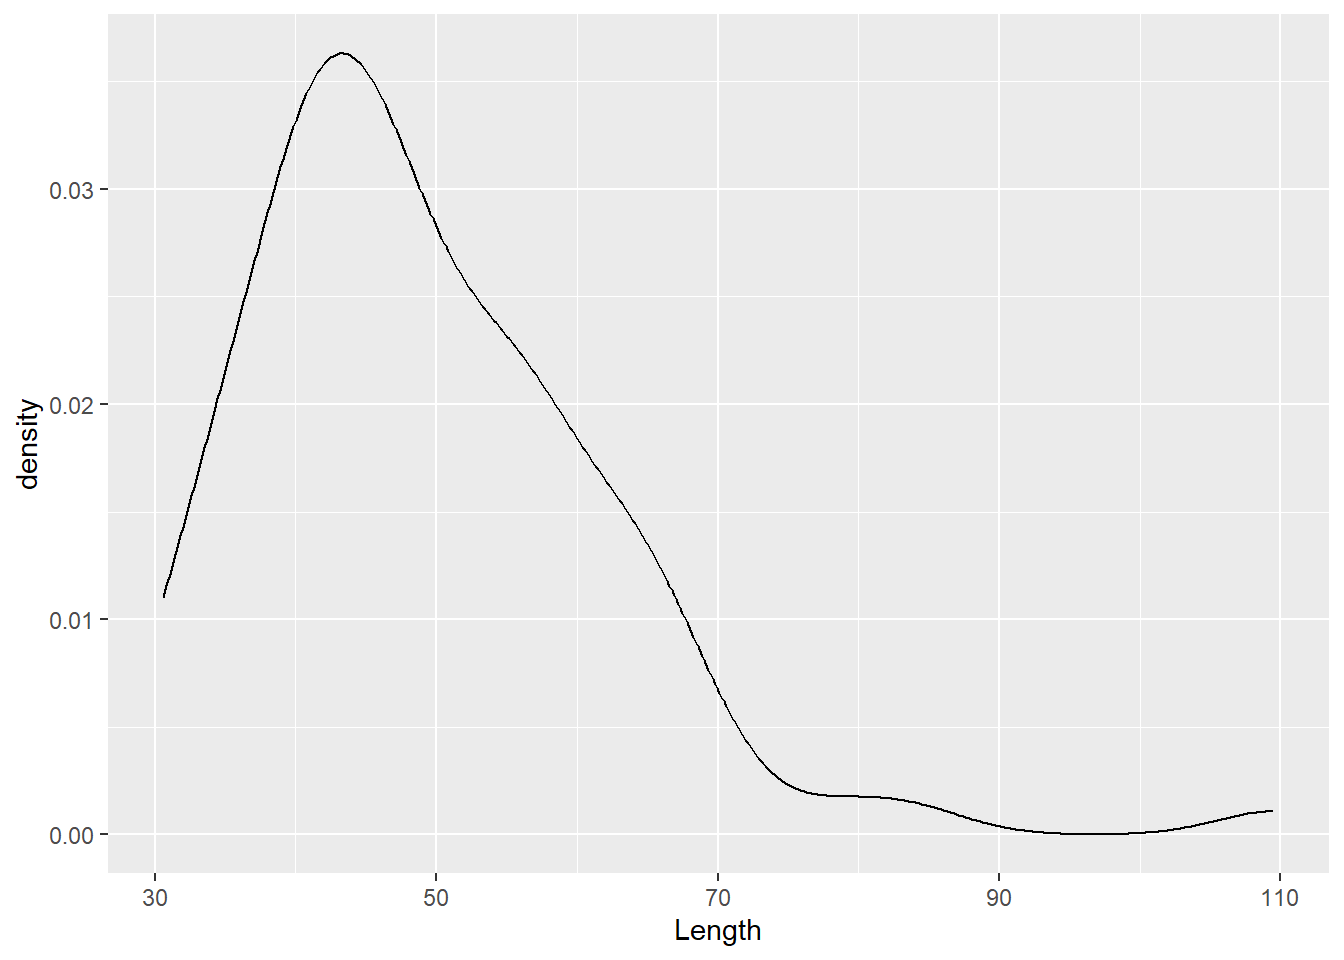
Other shapes of distributions