Data manipulation with dplyr
Data Transformation
Package
dplyr
Goals
We will learn how to:
- select desired variables –
select() - rename your variables –
rename() - order them from lowest to highest values (or vice versa) –
arrange() - filter your data based on different conditions –
filter() - calculate different summary statistics such as mean or count –
summarise() - add new variables such as percentage –
mutate() - work with different functions more effectively –
%>% - save your results as comma separated file
Before we begin
- load packages
hereanddplyr(don’t forget to install them firstly, if you haven’t done so yet) - open the project from last lecture (or create a new one if you don’t have it)
- create a new script
- load data dartpoints.csv into your script
- if you are loading data with
herefunction don’t forget to check whether your data and script are in the same folder as your project - create an object called “sipky” from the loaded database (with
<-)
Selecting variables
select(dataframe, variable1, variable2)- sometimes you will need to remove variables you don’t need in your work, to have your database more user friendly
- for example, you need only variables dealing with major proportions of the dartpoints, but your database have plenty of other variables which are making it difficult to observe, like here:
  Name Catalog     TARL  Quad Length Width Thickness B.Width J.Width H.Length
1 Darl 41-0322 41CV0536 26/59   42.8  15.8       5.8    11.3    10.6     11.6
2 Darl 35-2946 41CV0235 21/63   40.5  17.4       5.8      NA    13.7     12.9
3 Darl 35-2921 41CV0132 20/63   37.5  16.3       6.1    12.1    11.3      8.2
4 Darl 36-3487 41CV0594 10/54   40.3  16.1       6.3    13.5    11.7      8.3
5 Darl 36-3321 41CV1023 12/58   30.6  17.1       4.0    12.6    11.2      8.9
6 Darl 35-2959 41CV0235 21/63   41.8  16.8       4.1    12.7    11.5     11.0
  Weight Blade.Sh Base.Sh Should.Sh Should.Or Haft.Sh Haft.Or
1    3.6        S       I         S         T       S       E
2    4.5        S       I         S         T       S       E
3    3.6        S       I         S         T       S       E
4    4.0        S       I         S         T       S       E
5    2.3        S       I         S         T       S       E
6    3.0        S       E         I         T       I       C
Selecting variables
- to create a new dataframe, simply use function
selectand define which variables you want to keep
Renaming variables
- renaming your variables with function
rename(data, new_name = old_name)can be useful when dealing with complicated code names or different languages - Hint: don’t forget to save object with new variable names by
<-
Arranging values in ascending order…
- here you can order your observations from the lowest to highest (or vice versa). To do so, use function
arrange(data, variable)
…and in descending order
- if you want to order the values from higher to smaller just add
desc()
         typ delka sirka hmotnost
1 Pedernales 109.5  49.3     28.8
2 Pedernales  84.0  21.2      9.3
3 Pedernales  78.3  28.1     14.8
4 Pedernales  70.4  30.4     13.1
5     Travis  69.0  20.9     11.4
6 Pedernales  67.2  27.1     15.3
Task: What will happen if you will try to order non-numerical variable, but a categorical variable (such as type of the dartpoint)?
Filtering
- function
filter(data, variable <operator> value)allows you to filter your data based on different conditions, for example minimal weight, type of the dartpoint, etc - logical and mathematical operators: ==, !=, <, >, >=, <=, &, |, etc (use
?dplyr::filterfor more details)
- here we use
>to get only dartpoints with the length higher than 80 cm
- and here we use
==to choose only those dartpoints which are of type “Travis”
      typ delka sirka hmotnost
1  Travis  56.5  21.1      9.5
2  Travis  54.6  22.4     10.4
3  Travis  46.3  21.3      7.5
4  Travis  57.6  18.9      8.7
5  Travis  49.1  21.4      6.9
6  Travis  64.6  21.5     15.0
7  Travis  69.0  20.9     11.4
8  Travis  40.1  18.4      6.3
9  Travis  41.5  19.2      7.5
10 Travis  46.3  17.9      5.9
11 Travis 39.6 21.5 5.4- alternatively, you can exclude all points of a type “Travis” by negation
!=
- add
&if you want to filter with more than one condition, for example here we will filter all points which are type “Wells” AND are heavier than 10 grams
- Task: instead of
&try operator|(OR) and see how the result differs
Filtering based on a vector
- you can make your code less complicated when you create vector from desired values and then filter all observations which fall into that vector by using operator
%in%
Summaries
- we already know some functions to calculate basic summaries, for example function
mean
- but if you want to create a new dataframe from calculated statistics, function
summarise(data, new_variable = summary_statistics)is much more helpfull - for summary statistics you can use different functions:
mean(),median(),sd(),min()…, (use?summarisefor more details)
Grouping
- summaries above were applied on whole dataframe. Here we will learn how to calculate summaries for each type of the dartpoint by using
group_by(data, variable_to_be_grouped_by)
- at first sight, you don´t see any differences, but they will be visible after applying function
summarise
- you can also calculate more summaries at once and use
roundto remove unnecessary decimals:
- Task: save the result as a new dataframe “sipky_sum” for later work
Mutate
- function
mutatecreates a new variable, here we will show how to add variable with percentages - note:
sumcalculates a total sum of values from chosen variable (in this case - “pocet”)
- Hint: you can again remove unnecessary decimals by adding
roundbut be careful with the right number of the brackets()!
Pipe operator
- when applying plenty of transformation on one dataset “pipe operator” (
%>%) could make your work easier and code shorter and more readable - notice you don´t need to repeat the name of the dataframe into every function arguments, since you already specified it in the begining of the “pipe”
More complex summarising with dplyr and pipe
sipky %>%
  group_by(typ) %>%
  summarise(
    delka_prum = round(mean(delka), 1),
    hmotnost_prum = round(mean(hmotnost), 1),
    pocet = n()) %>%
  mutate(procento = round(pocet/sum(pocet)*100, 1)) %>%
  arrange(desc(pocet))
# A tibble: 5 × 5
typ delka_prum hmotnost_prum pocet procento
<fct> <dbl> <dbl> <int> <dbl>
1 Pedernales 57.9 10.6 32 35.2
2 Darl 39.8 4.4 28 30.8
3 Travis 51.4 8.6 11 12.1
4 Ensor 42.7 5.1 10 11
5 Wells 53.1 8.7 10 11 Visualising your summaries
sipky %>%
  group_by(typ) %>%
  summarise(
    delka_prum = mean(delka),
    hmotnost_prum = mean(hmotnost),
    pocet = n()) %>%
  mutate(procento = round(pocet/sum(pocet)*100, 1)) %>%
  arrange(desc(pocet))
# A tibble: 5 × 5
typ delka_prum hmotnost_prum pocet procento
<fct> <dbl> <dbl> <int> <dbl>
1 Pedernales 57.9 10.6 32 35.2
2 Darl 39.8 4.41 28 30.8
3 Travis 51.4 8.59 11 12.1
4 Ensor 42.7 5.06 10 11
5 Wells 53.1 8.68 10 11 Visualising your summaries
sipky %>%
  group_by(typ) %>%
  summarise(
    delka_prum = mean(delka),
    hmotnost_prum = mean(hmotnost),
    pocet = n()) %>%
  mutate(procento = round(pocet/sum(pocet)*100, 1)) %>%
  arrange(desc(pocet)) %>%
  ggplot() +
  aes(x = typ, y = delka_prum) +
  geom_col() +
  labs(title = "Průměrná délka šipky") +
  theme_light()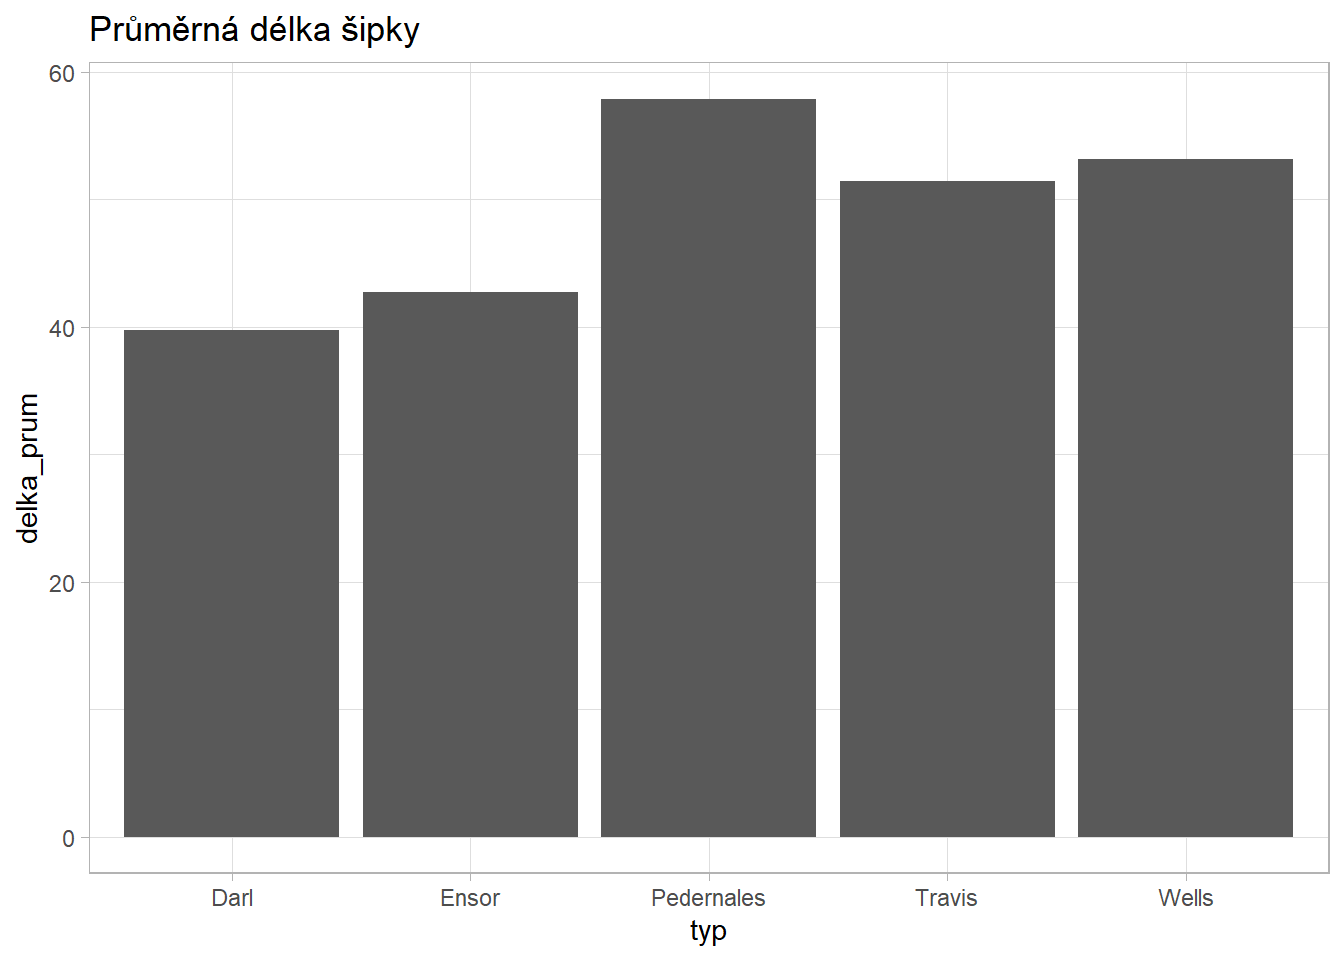
Saving your results
- use
write.csvfor saving your results as a comma separated file
- or save your summarised data frame as an object and save it later
Exercise
- Create new a script in your project folder and save.
- Load packages necessary for: (a) loading, (b) transformation, and (c) visualization of data.
- Load database
bacups.csvand save it as an object. - Create a new dataframe having only variables
H,RDandPhase. - Try to use pipes
%>%. - Rename the variables to
height,rimdiameterandphase. - For each phase calculate following summary statistics:
- mean and median vessel height,
- standard deviation of vessel height,
- correlation between height and rim diameter, and
- number of vessels.
- mean and median vessel height,
- Calculate percentage of vessels in each phase.
- Arrange the results from highest to lowest mean values.
- Save your result as a CSV file
- Are height of vessels or rim diameter normally distributed? Why/why not?