Clustering
Clustering
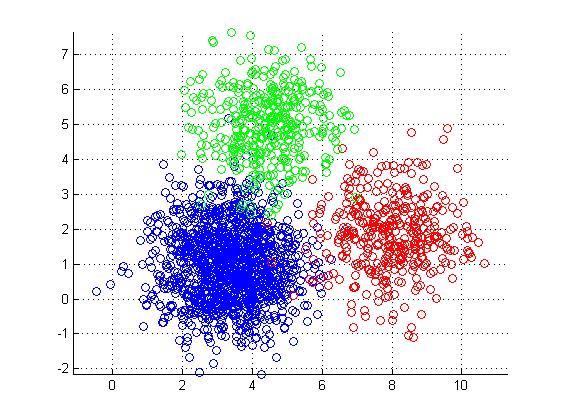
- Broad set of techniques for finding subgroups.
- Observations within groups are quite similar to each other and observations in different groups quite different from each other.
Clustering methods
- Partitioning: k-means clustering
- Agglomerative/divisive: hierarchical clustering
- Model-based: mixture models
K-means clustering
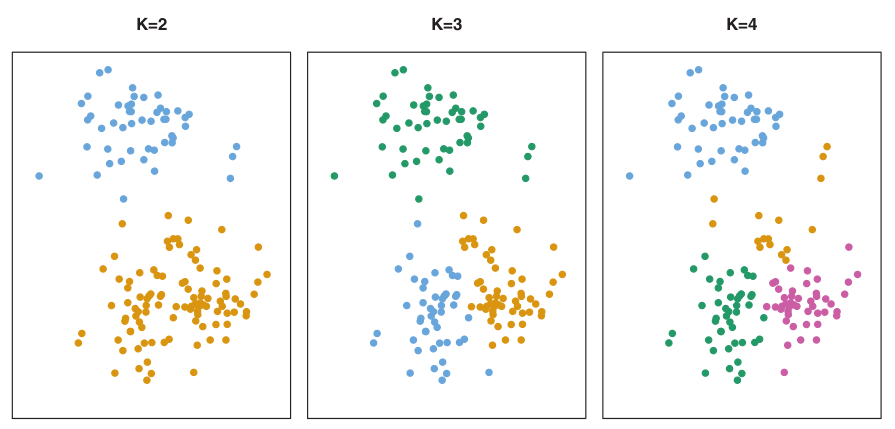
- Simple approach to partitioning a data set into K distinct, non-overlapping clusters.
- K is specified beforehand.
James et al. 2013
K-means algorithm
- \(K\) – number of clusters.
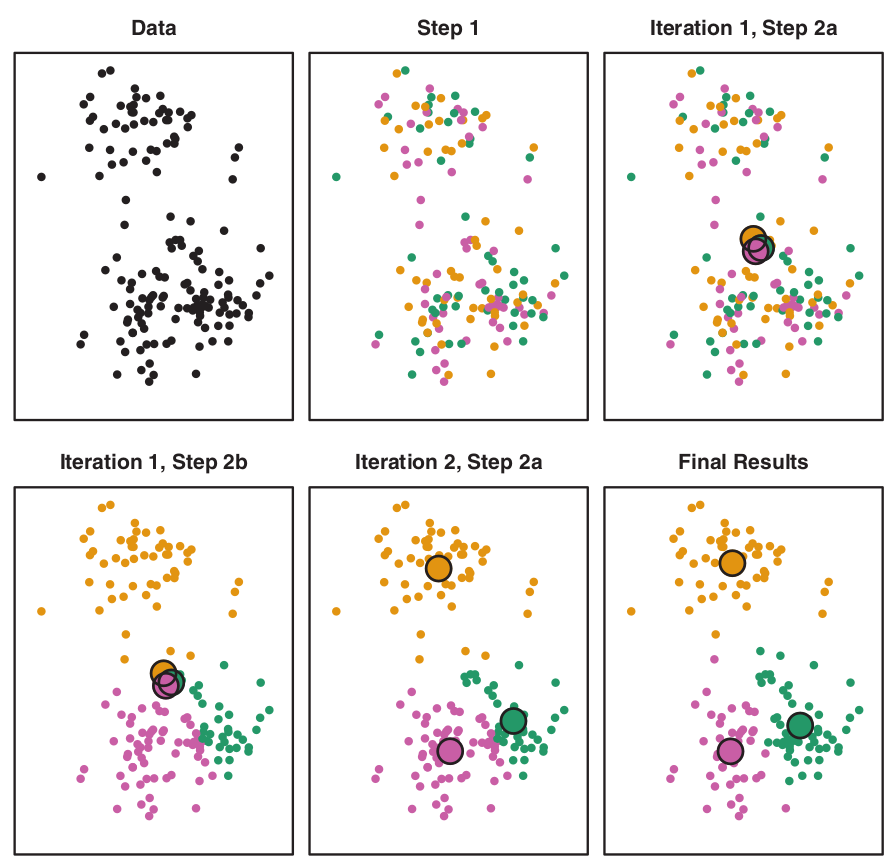
The process:
- Randomly assign each observation to groups 1 to K;
- For each of K clusters, derive its centroid (midpoint);
- Reassign each observation into a cluster whose centroid is the closest;
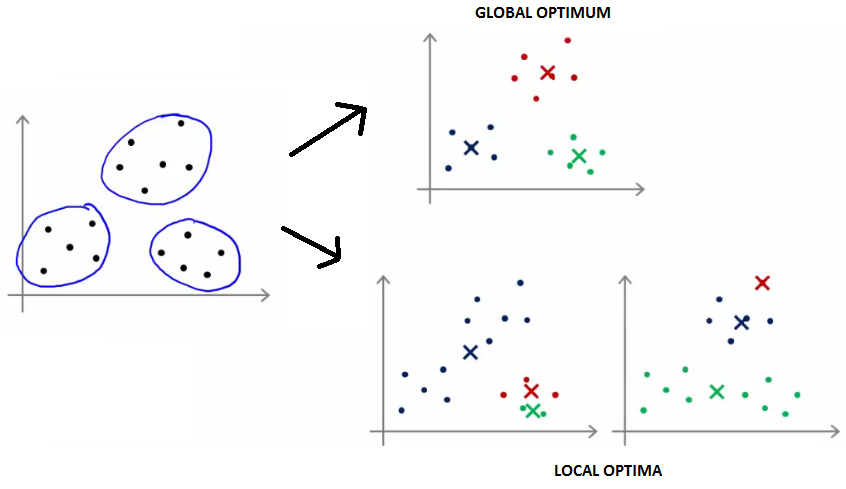
- Iterate until stability in cluster assignments is reached (local vs global optima).
Some properties of K-means partitioning
- Standard algorithm for k-means clustering is using Euclidean distance (distances are calculated using Pythagorean theorem).
- Different local optima (stability) can be reached.
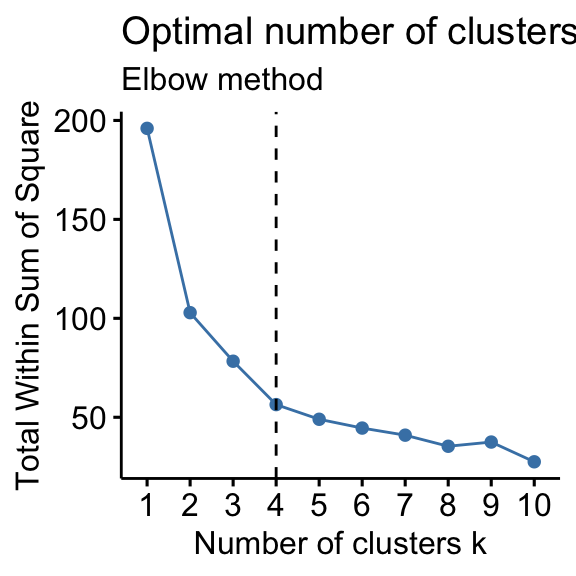
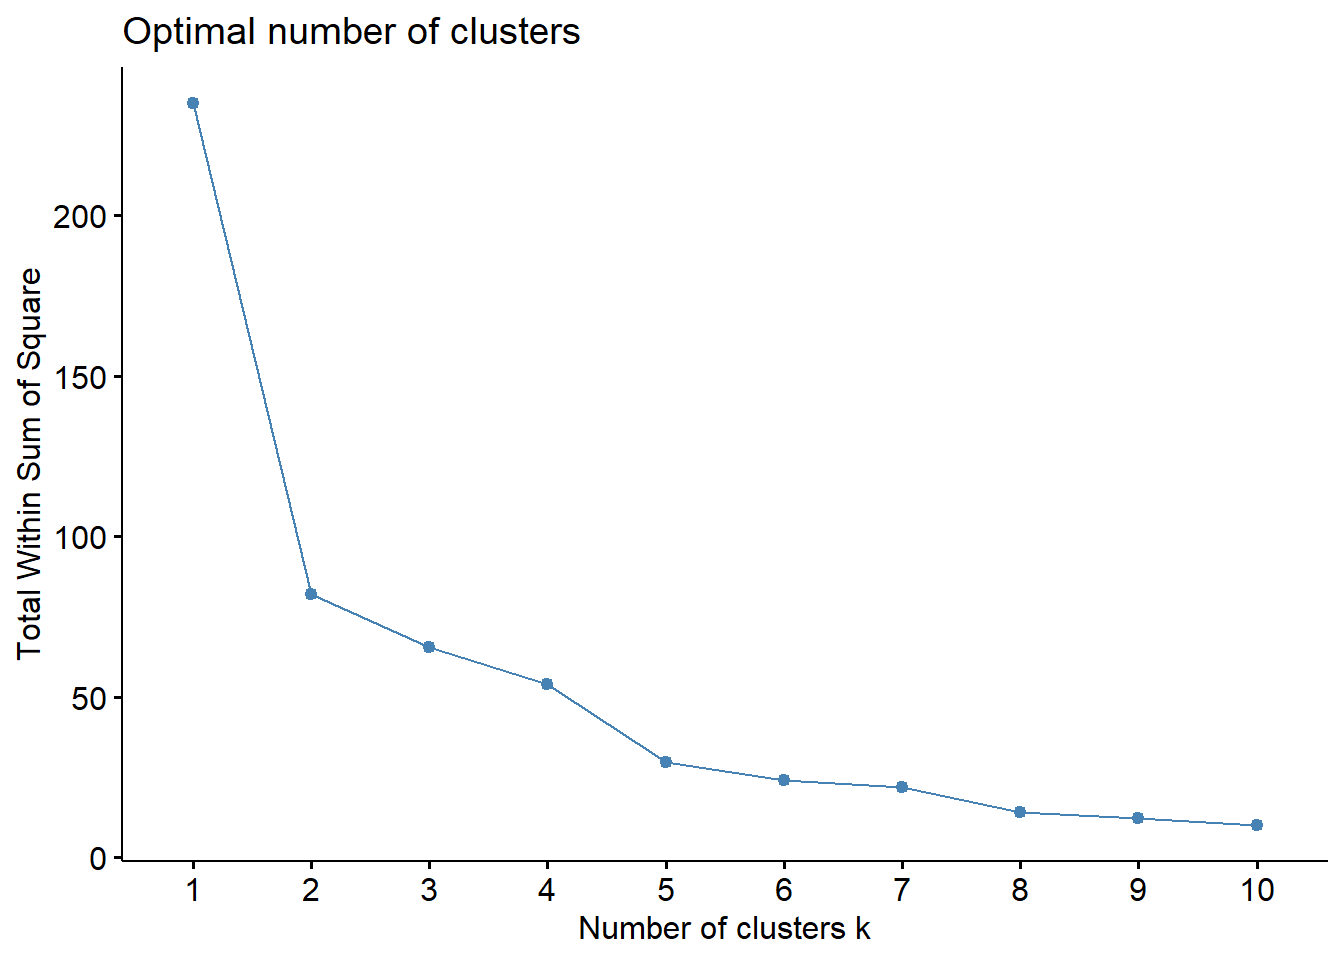
Number of clusters K must be specified in advance
How to determine optimal number of clusters?
- Elbow method,
- Silhouette method
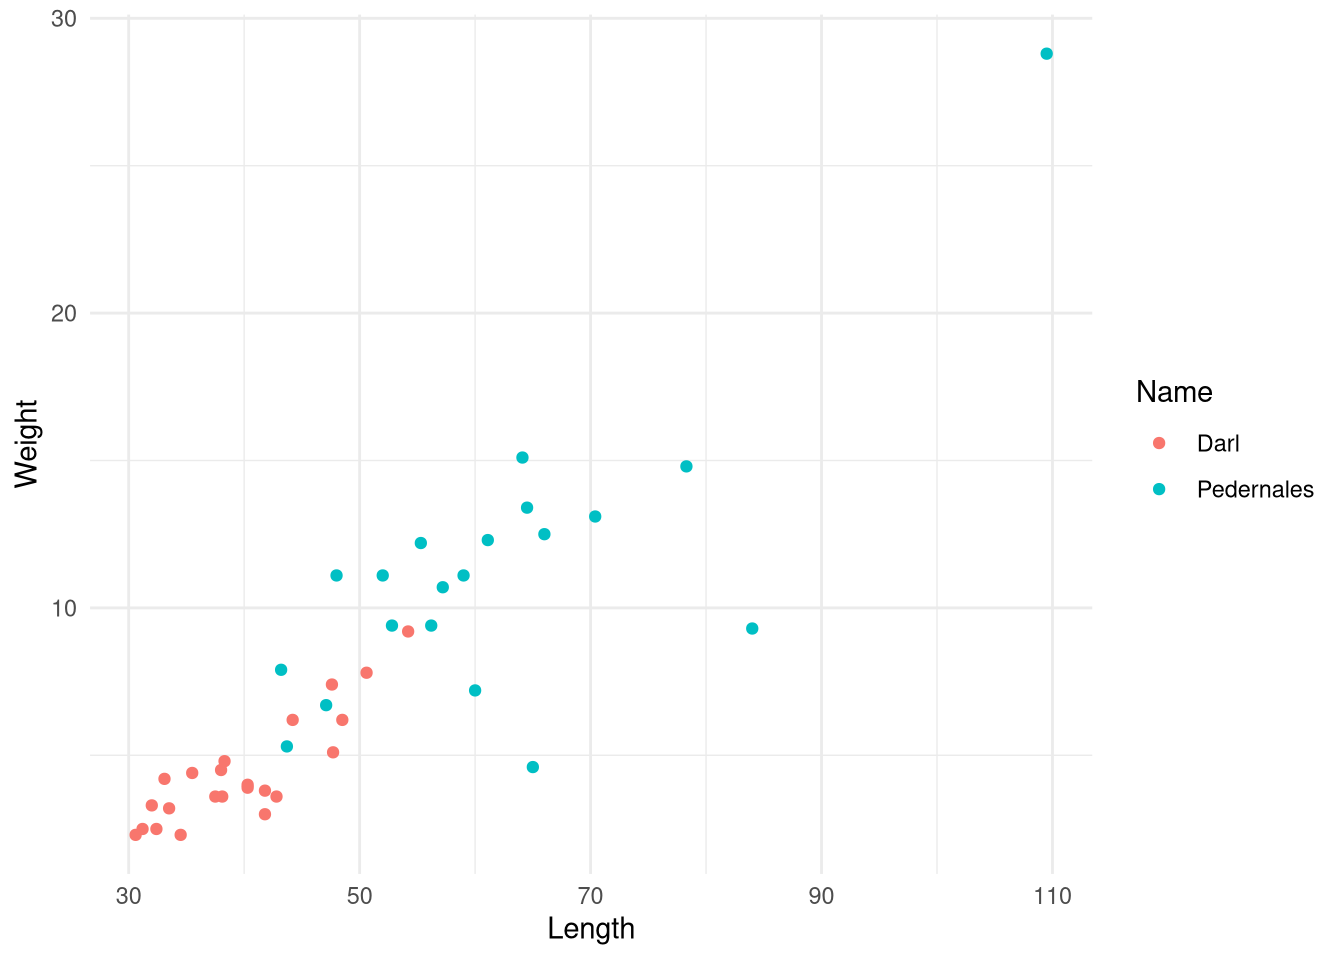
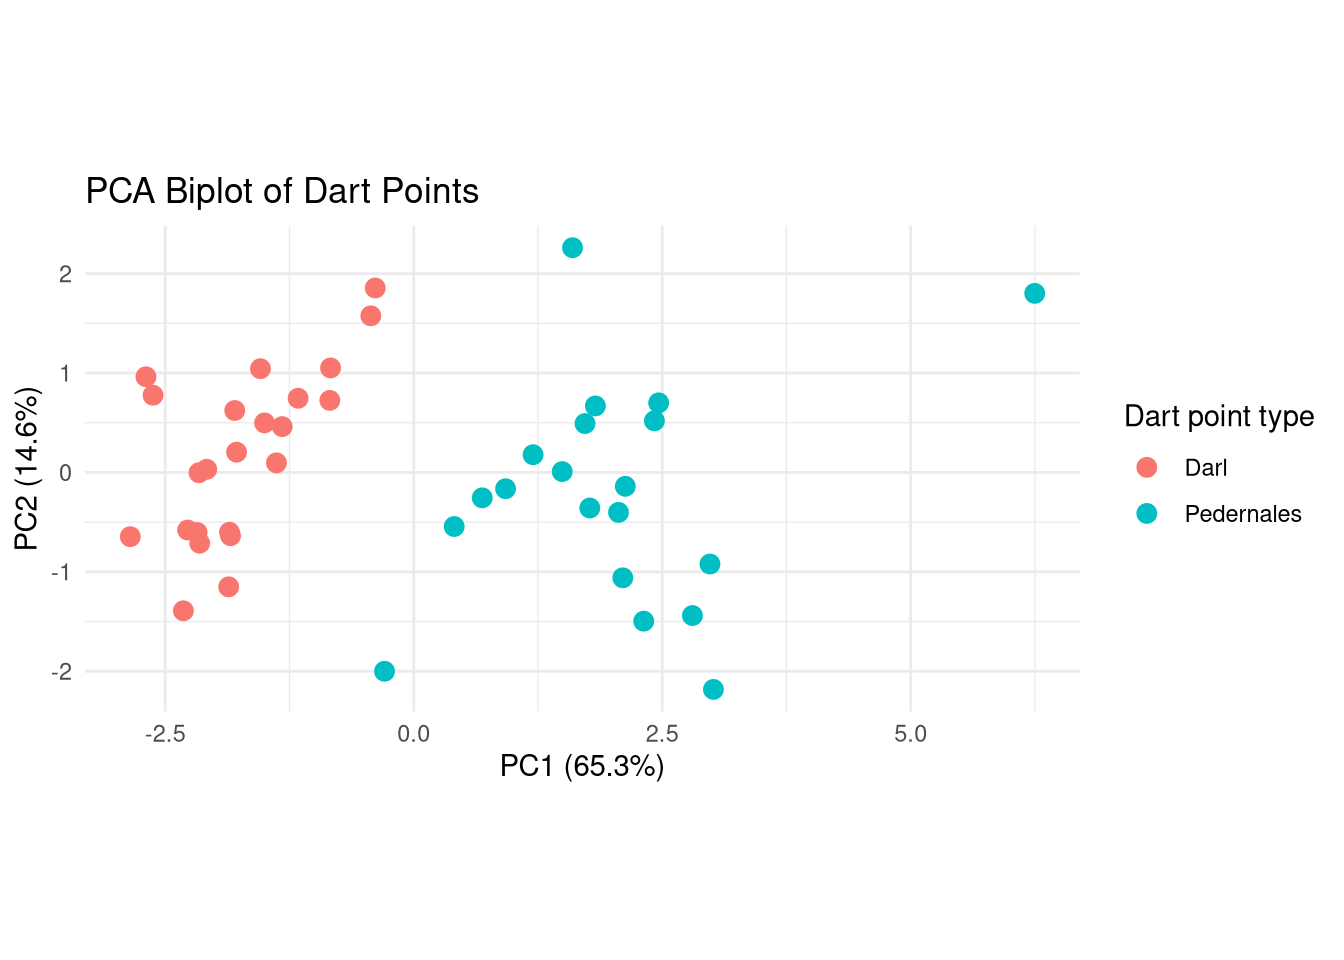
Scatterplot
Biplot
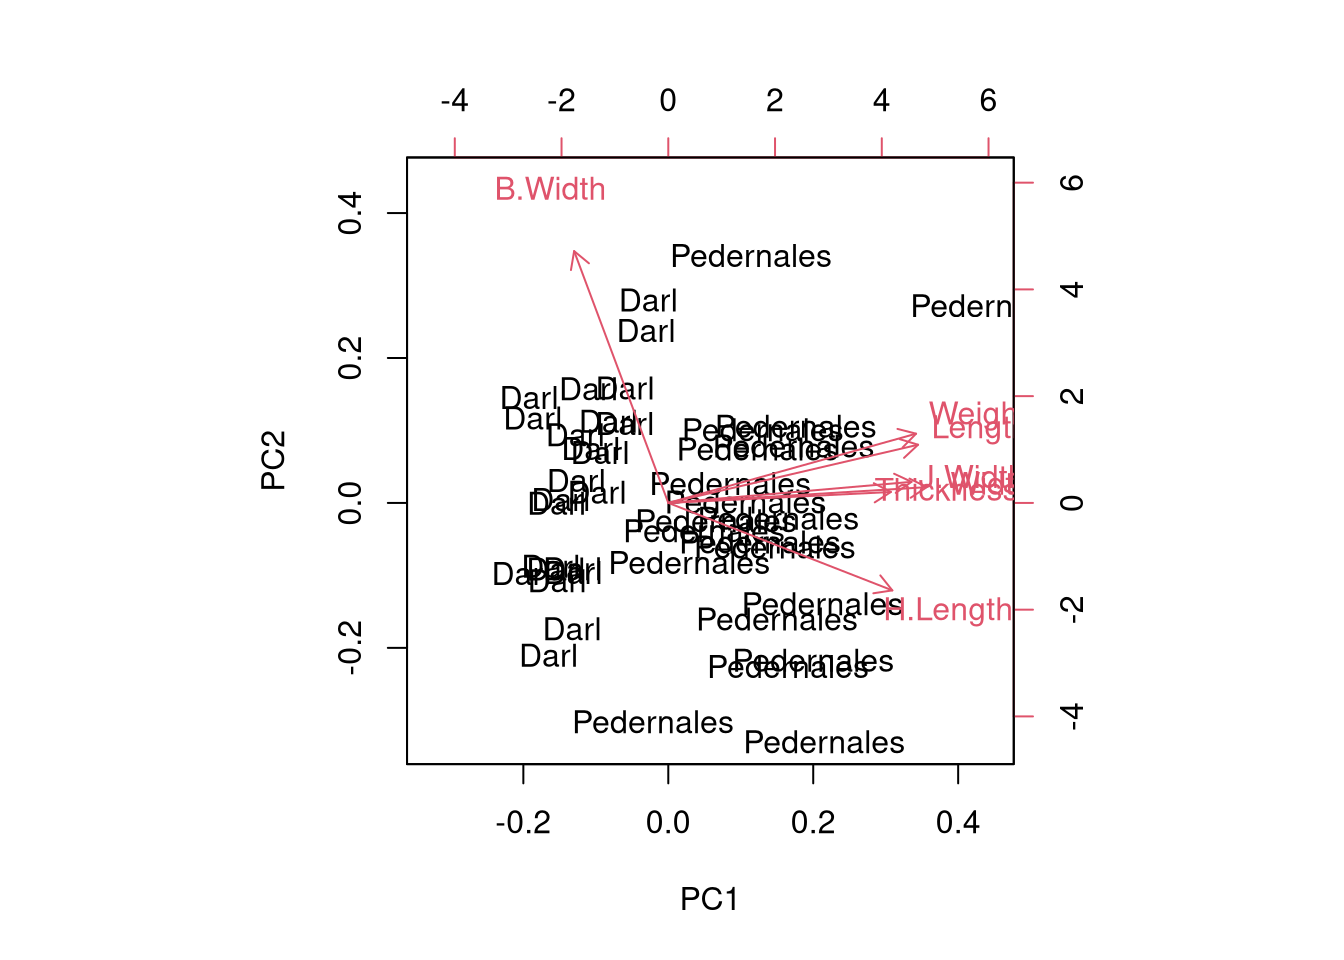
ggplot2 biplot
How many clusters?
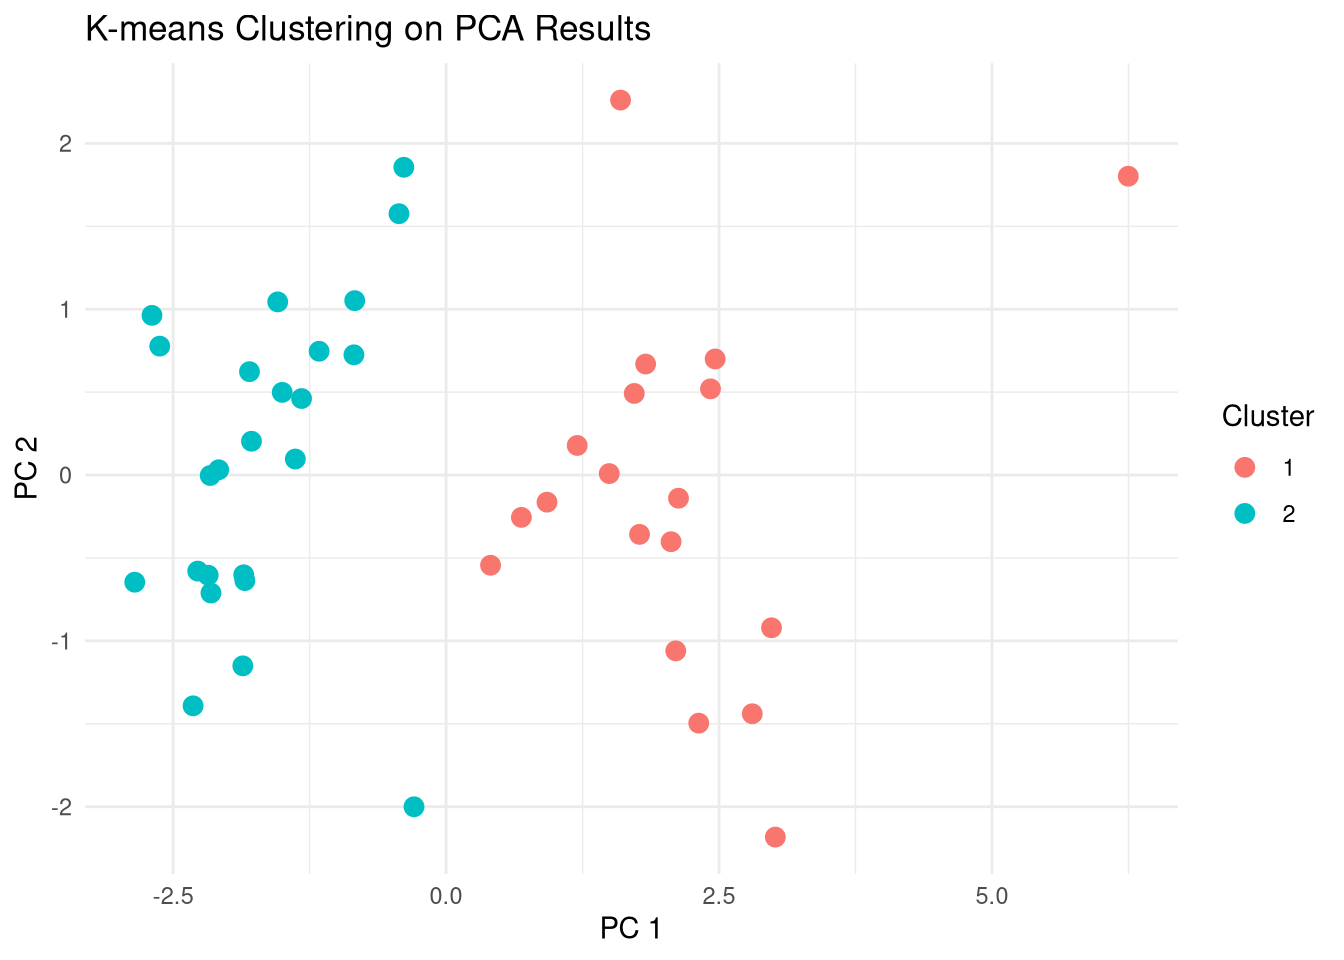
Plot
Compare clusters with Names
    Darl Pedernales
  1    0         19
  2   23          1
# Compare clusters to original names, i.e., dart point types
pca_scores |>
ggplot() +
aes(
x = PC1, y = PC2,
color = dp$Name,
shape = factor(kmeans_result$cluster)
) +
geom_point(size = 3) +
theme_minimal() +
labs(title = "K-means Clustering on PCA Results",
x = "PC 1",
y = "PC 2",
color = "Type of dartpoint",
shape = "Cluster")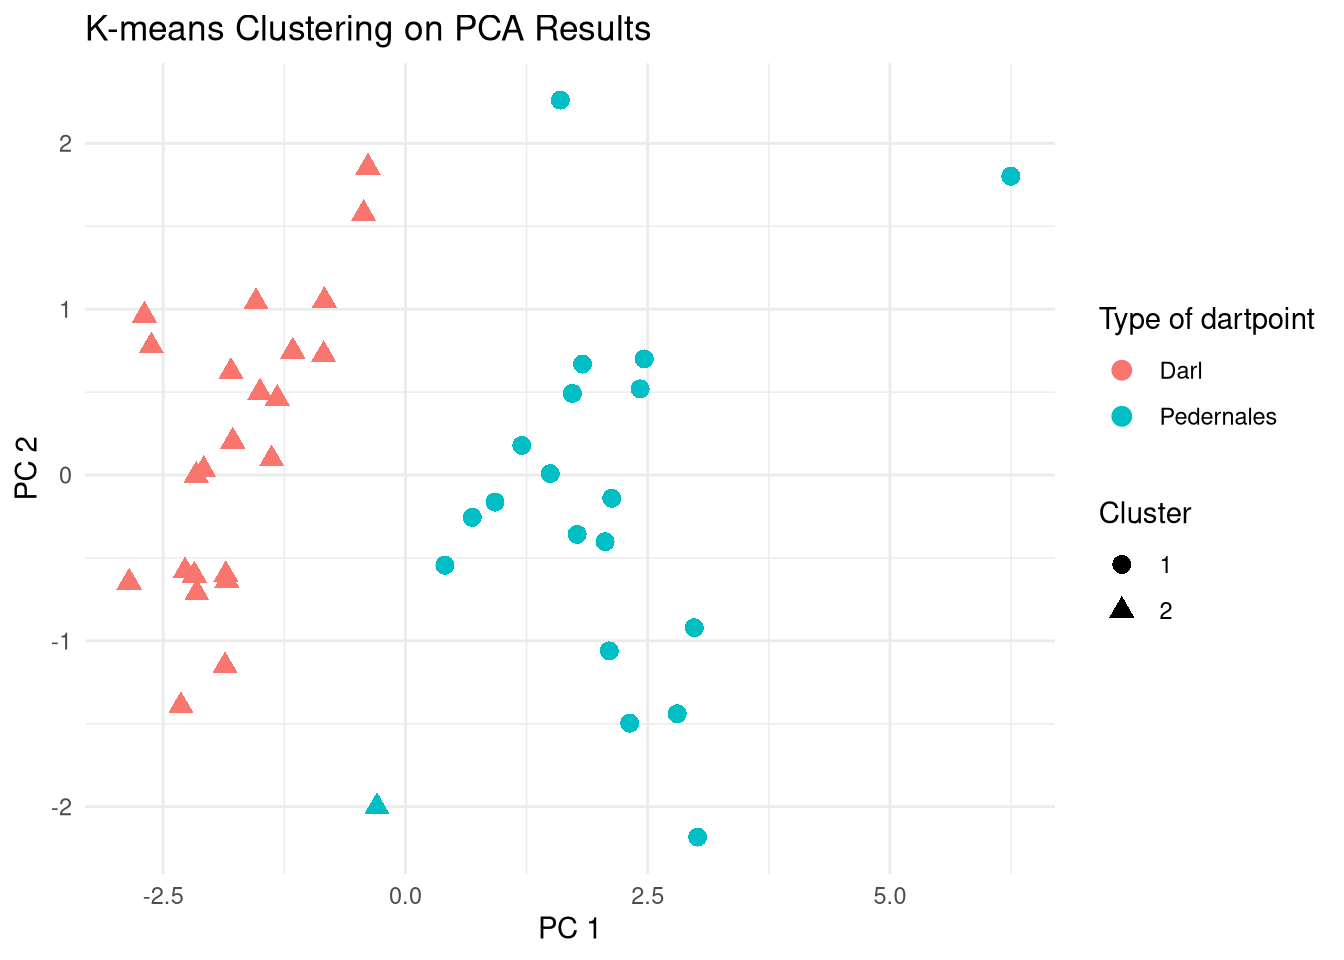
Hierarchical clustering
- The number of clusters is not specified beforehand.
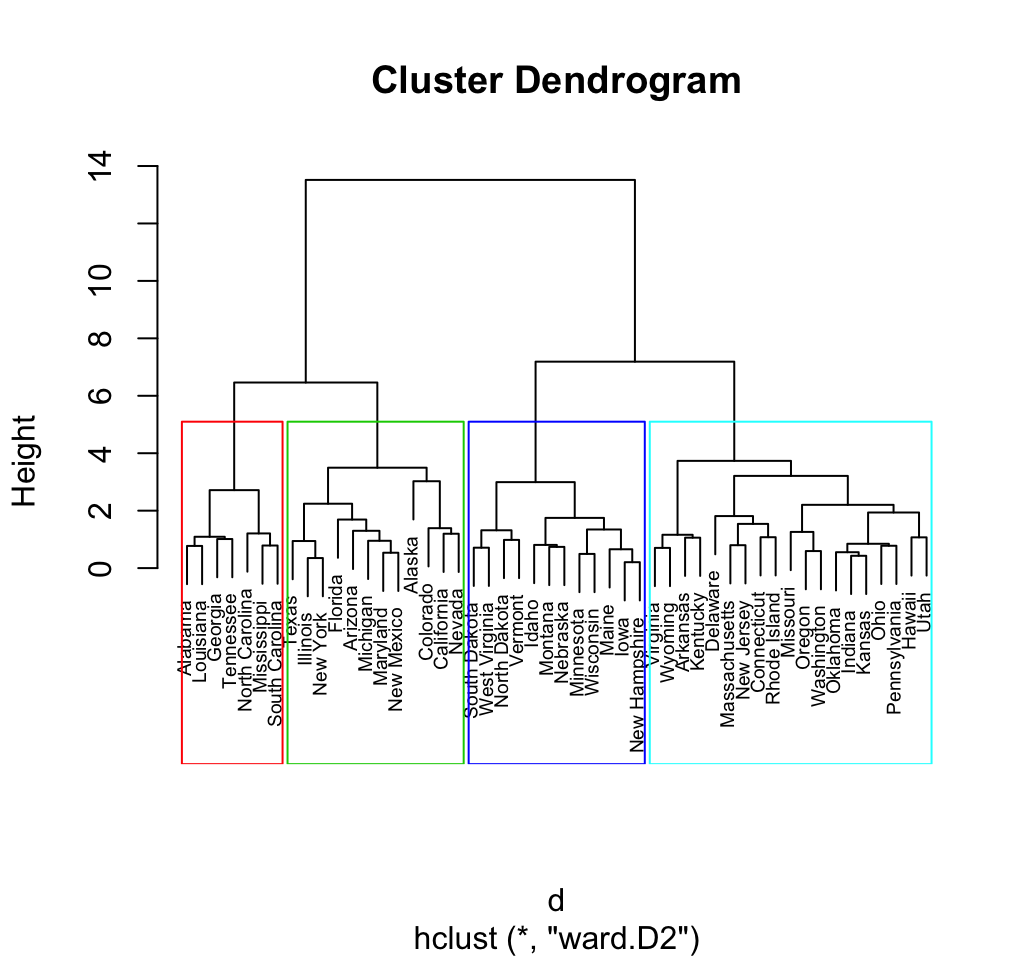
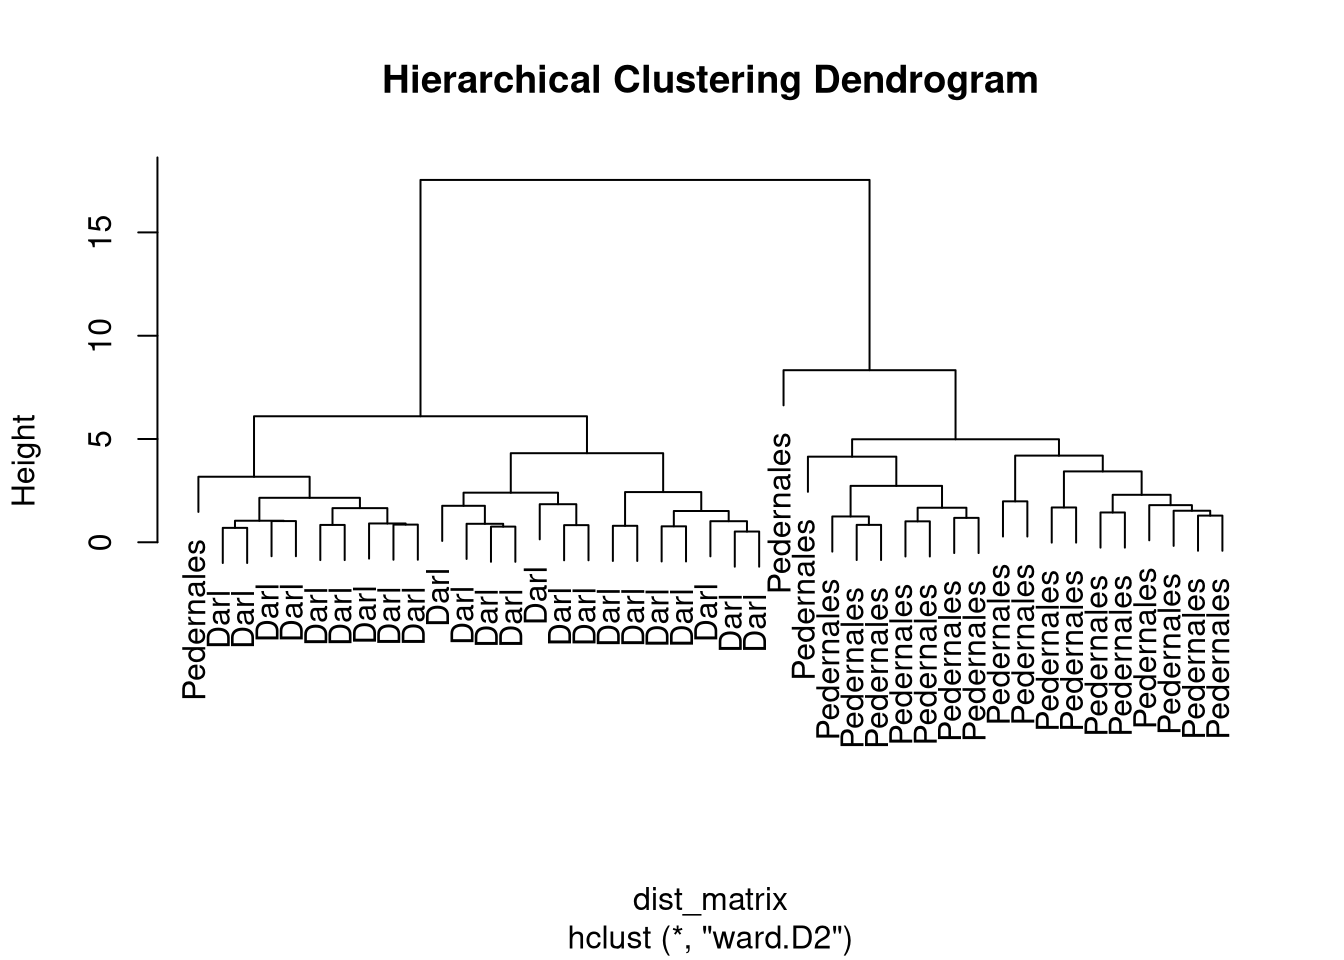
- Output is a dendrogram – a hierarchical structure visualizing the cluster growth.
- Starts with a distance matrix.
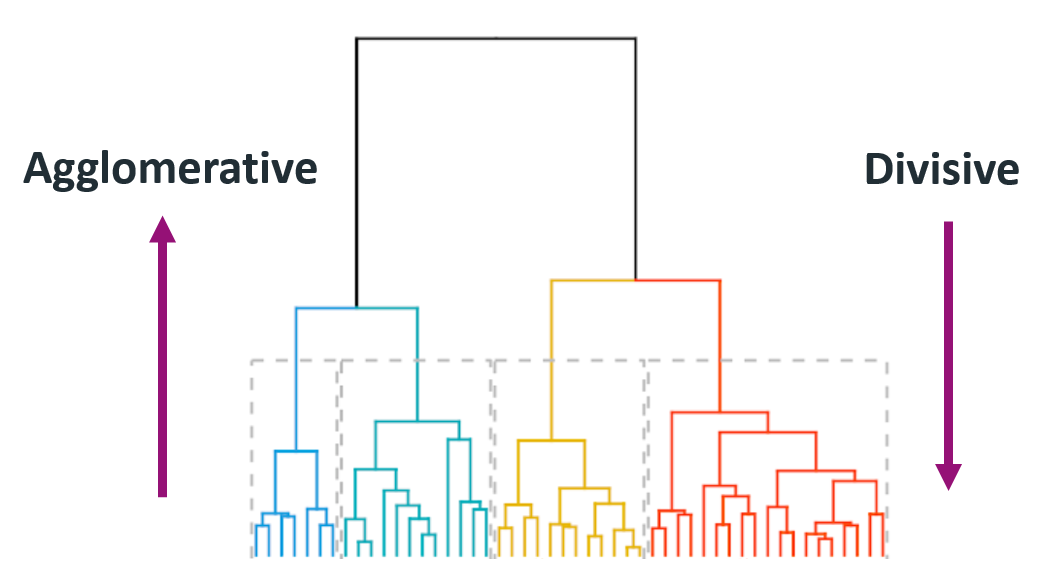
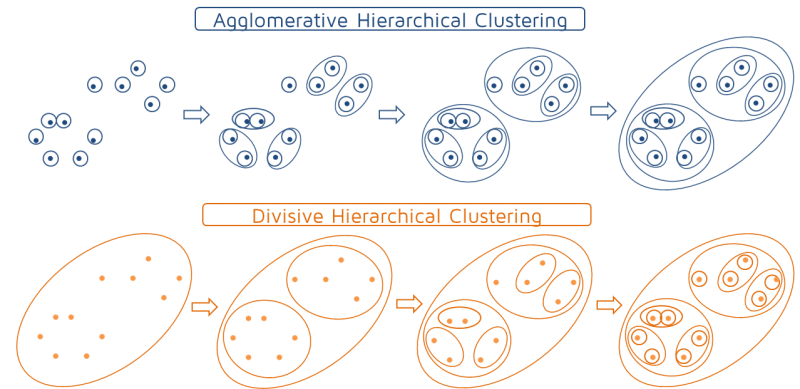
Agglomerative
- Builds the hierarchy of clusters from bottom-up until a single cluster is reached.
- Put each object in its own cluster;
- Join the clusters that are the closest;
- Iterate until a single cluster encompassing all objects is reached.
Divisive
- Divides a single large cluster into individual objects (top-down).
- Put all objects into a single cluster;
- Divide the cluster into subclusters at a similar distance;
- Iterate util all objects are in their own clusters.
Hierarchical clustering algorithms
Dendrogram
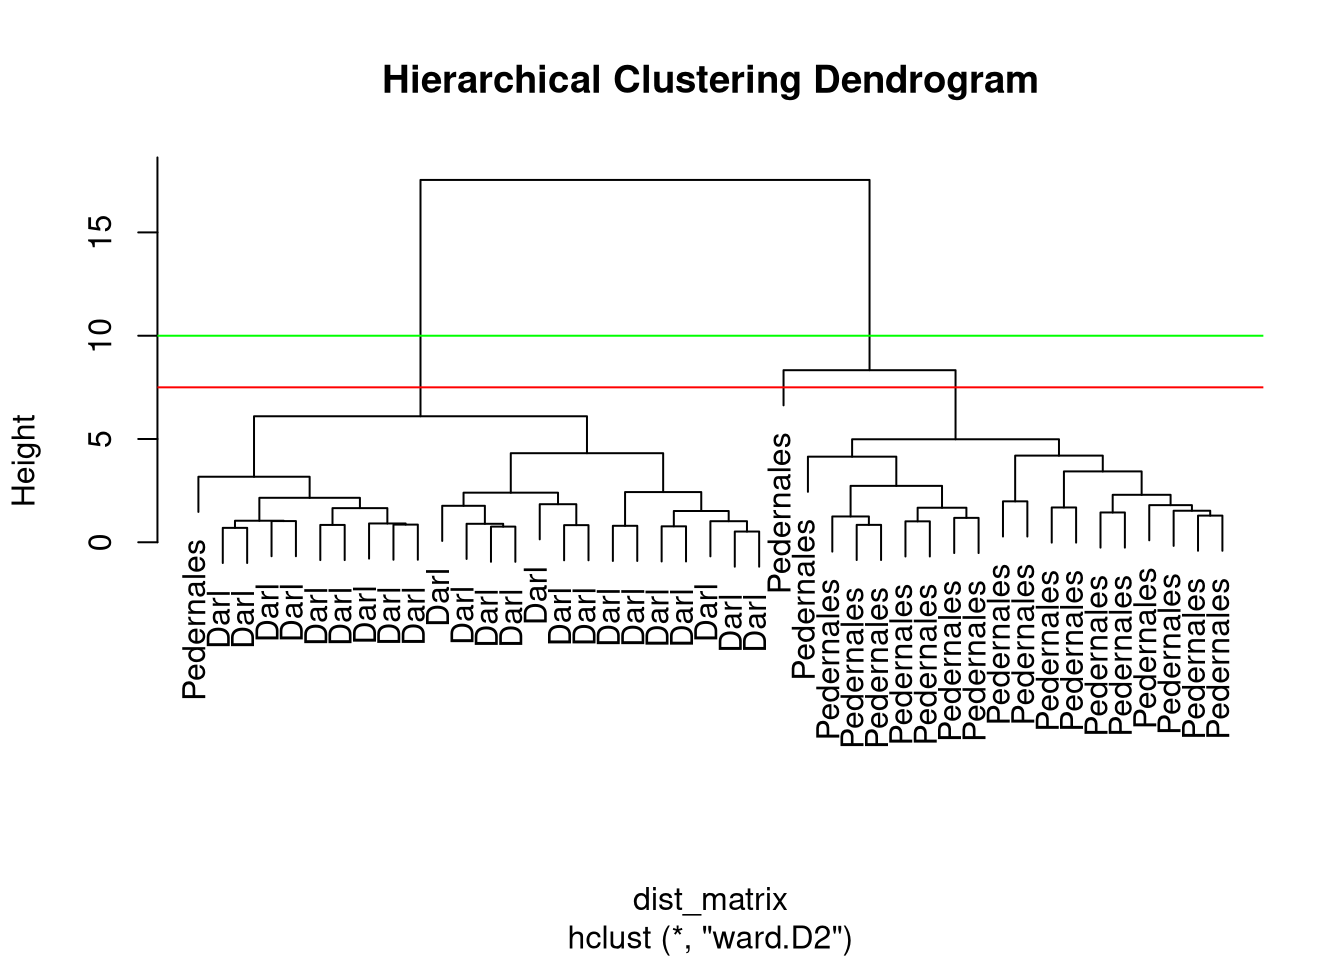
Clusters
- Different options where to cut the dendrogram…
- function
cutree(x, k, h) - specify
k– number of clusters or h– height where to cut the dendrogram
Clustering methods comparison
K-means partitioning
- Pre-specified number of clusters.
- Clusters may vary (different local optima).
- Best when groups in data are (hyper)spheres.
Hierarchical clustering
- Variable cluster numbers.
- Clusters are stable.
- Any shape of data distribution.